We are currently accepting entries for our 2027 challenge!
Are you a data storyteller excited to show the campus community what you can do? Are you a student looking for a fun way to highlight your data viz skills? Are you a researcher using an innovative design to communicate your research?
Bucky’s Data Viz Challenge, sponsored by the UW—Madison Libraries and the Office of Data, Academic Planning & Institutional Research, provides a platform for UW–Madison to showcase their creative data visualization skills. It is open to:
- Students.
- Postdocs.
- Faculty.
- Staff.
Check out the details for our student contest and postdoc, faculty, and staff competition.
Looking for inspiration? Our gallery of previous submissions can help.
We are currently accepting entries. All entries are due by 11:59 pm on Wednesday, January 6, 2027.
This annual challenge determines UW–Madison’s entries in the BTAA’s Data Viz Championship held during Love Data Week, a celebration of data held each year during the week of Valentine’s Day.
Love Data Week at UW—Madison will have more information about events and activities for Love Data Week 2027, February 8 to 12, in early January.

How will the winners of Bucky's Data Viz Challenge be decided?
From UW-Madison’s submitted visualizations, a group of campus faculty, staff, and leadership will select one student and one faculty/staff data visualization to represent UW–Madison at the virtual BTAA Data Viz Showcase held during Love Data Week. They will consider:
- Visual design and presentation: visual clarity, overall aesthetics and layout, and accessibility.
- Clarity of communication: clear communication that tells a story.
- Creativity and innovation: originality, including sparking interest or discussion.
- Audience understanding and insight: insightful and encourages deeper reflection.
I had a great time working with the data and did my best to visualize it using the skills I’ve learned in the GIS master’s program.
This competition is so meaningful, and it has definitely made my winter break more colorful!
Eugenie Huang
GISPP Fellow with the State Cartographer’s Office and UW—Madison’s 2025 student entry for the BTAA’s Data Viz Championship
Student challenge

Does home court really matter? Do the teams that shoot more threes actually win more? What about the impact of defensive rebounds?
This year’s Bucky’s Data Viz Challenge asks students to analyze data about women’s NCAA basketball and then construct a compelling data visualization.
- Show off your creativity! Analyze the data and share it in a high-impact, easy-to-understand format.
- Become a team of two! You can work with another person as long as both are credited.
- Take a shot at exploring a new tool! Any tool (or a combination of tools) may be used for your visualization. This is not limited to Tableau or Power BI.
Submission details and timeline for Bucky’s Data Viz Challenge.
Why should you participate?
- Participating helps you build your portfolio and resume.
- Bragging rights if you win!
- Entries are promoted on various campus media channels, helping your work and skills gain visibility.
- One entry will represent UW–Madison in the BTAA’s Data Viz Championship. The BTAA awards a $500 scholarship to the winner of the Chart Topper: Judges’ Award for Excellence (based on a scoring rubric) and a $100 Amazon gift card to the winner of the Love It! Award (based on audience votes).
Data analysis and design resources
- Dig into the Data for Bucky’s Data Viz Challenge
- Crafting a Compelling Data Story for Bucky’s Data Viz Challenge
- Tableau for students
- Adobe Creative Cloud software (Net ID required)
- UW–Madison's Data Science Hub
- UW–Madison's DesignLab
- Datawrapper
- 2026 Bucky's Data Viz Challenge entries
- 2026 BTAA Student Data Viz Showcase entries
Bucky's Data Viz Challenge student workshops
Dig into the Data
When: Thursday, November 5 from 4:00–5:30 p.m.
Where: STEM Commons, Room 126, Steenbock Library
Registration required.
Does home court really matter? Do the teams that shoot more threes actually win more? This hands-on session is about answering questions like these with a spreadsheet. Working with the women’s NCAA basketball dataset behind this year’s Bucky’s Data Viz Challenge, we’ll use Excel to dig into the data and search for interesting questions and more interesting answers. You’ll leave knowing what’s in the data and what you want to say about it, with time to build an entry over winter break. No experience needed.
Crafting a Compelling Data Story
When: Thursday, November 12 from 4:00–5:30 p.m.
Where: College Library, Helen C. White Room 3250
Registration required.
Can you tell a data story that’s as interesting and exciting as College Basketball? In this session we’ll explore strategies for crafting compelling visualization for this year’s Bucky’s Data Challenge. We’ll cover choosing a chart type that fits your question, using color and labels deliberately, cutting what doesn’t earn its place, and writing a title that actually says something. Working with the women’s NCAA basketball data, we’ll build graphics in Excel and Datawrapper, a free tool that gets you from spreadsheet to publication-quality chart in minutes. Come with a finding or use one of ours. No experience needed.
Faculty, postdoc, and staff competition
Faculty, postdocs, and staff, this is your opportunity to share your innovative visualization and research with new audiences.
New and creative ways of visualizing data are encouraged. You can submit an existing visualization or design a new one. Examples include:
- An existing visualization that shares public research you are involved in.
- A visualization that highlights information about UW–Madison as a whole or about a specific initiative or population.
- Create a visualization using publicly available Big Ten data, such as athletics, enrollment data, and other relevant metrics.
One entry will represent UW–Madison in the BTAA’s Data Viz Championship. All submissions must follow institutional and research data policies and guidelines.
Submission details and timeline for Bucky’s Data Viz Challenge.
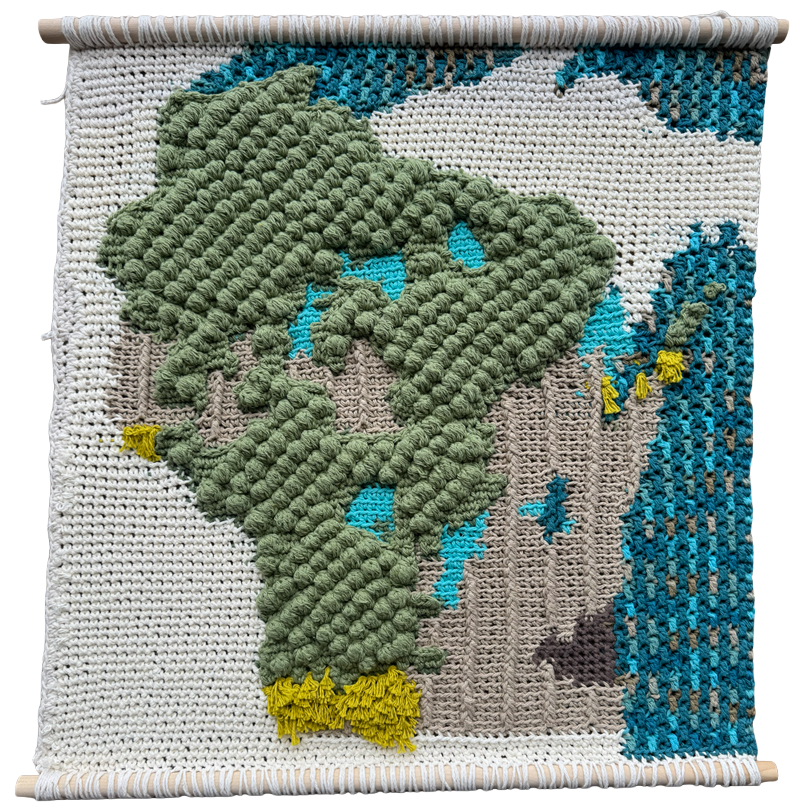
2026 Winning faculty/staff entry for Bucky’s Data Viz Challenge
A Crochet Land Cover Map of Wisconsin. Submitted by Andrew Hahn.
Submission details and timeline
Entries are submitted via a Google form and are due by 11:59 pm on Wednesday, January 6, 2027. Individuals may submit more than one entry. Each entry requires its own Google form, and all submissions must include:
- thumbnail image of the entry,
- visualization title,
- short description (no more than 250 words), and
- publicly available URL.
Submit your entry for Bucky’s Data Viz Challenge!
Please share this information with interested students, faculty, and staff. If you have any questions, email us.
BTAA Data Viz Championship
The Big Ten Academic Alliance (BTAA) Data Viz Championship is a showcase of data storytelling talent across Big Ten institutions. This exciting competition invites students, faculty, and staff to demonstrate their data visualization skills and vie for the title of BTAA Data Viz Champion.
From UW-Madison’s submitted visualizations, a group of campus faculty, staff, and leadership will select one student and one faculty/staff data visualization to represent UW–Madison at the virtual BTAA Data Viz Showcase held during Love Data Week. Additional details about the showcase, including how to vote, will be shared in early 2027.
