DAPIR compiles official degree numbers for the university. Updated tabulations of degree and certificates awarded are available each year in the late fall.
Degrees and Certificates
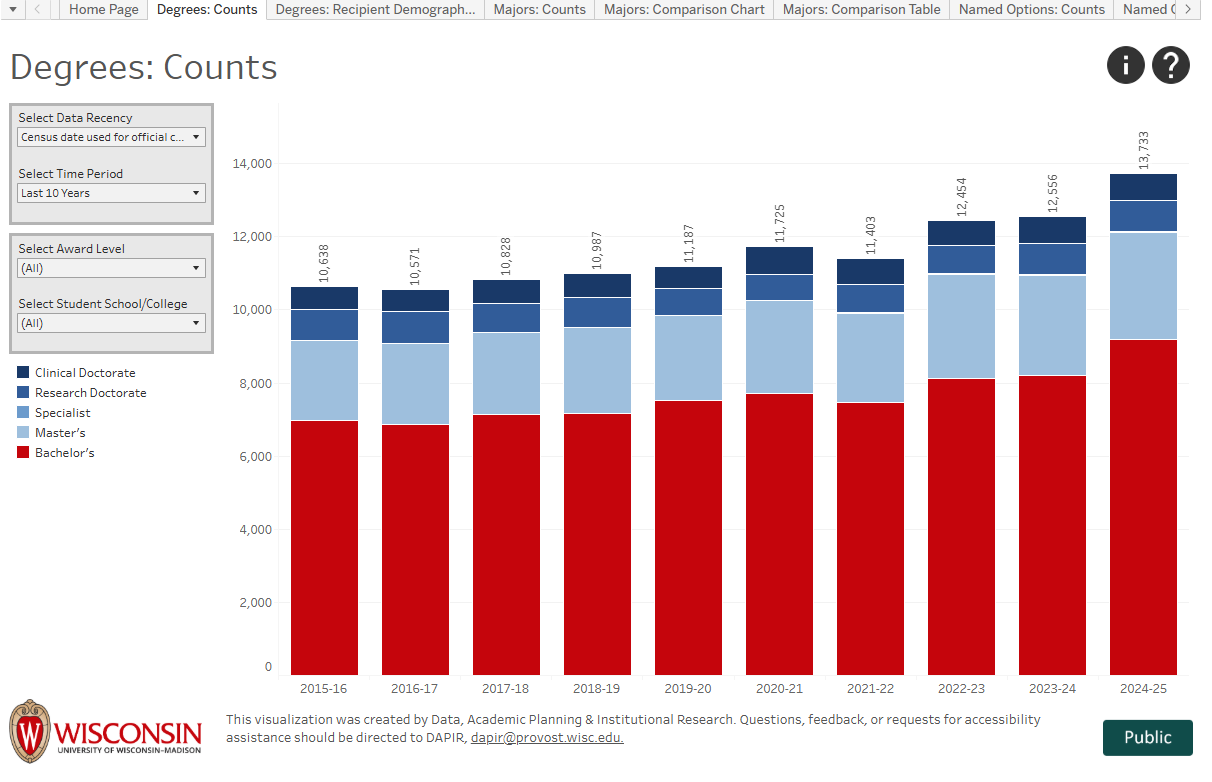
| Award Level | 2015-16 | 2016-17 | 2017-18 | 2018-19 | 2019-20 | 2020-21 | 2021-22 | 2022-23 | 2023-24 | 2024-25 |
| Bachelor's | 6,978 | 6,855 | 7,144 | 7,171 | 7,521 | 7,709 | 7,460 | 8,133 | 8,199 | 9,180 |
| Master's/Specialist | 2,188 | 2,224 | 2,228 | 2,347 | 2,326 | 2,559 | 2,470 | 2,859 | 2,777 | 2,954 |
| Research Doctorate | 851 | 875 | 803 | 816 | 738 | 697 | 773 | 777 | 845 | 850 |
| Clinical Doctorate | 621 | 617 | 653 | 653 | 602 | 760 | 700 | 685 | 735 | 749 |
| Total | 10,638 | 10,571 | 10,828 | 10,987 | 11,187 | 11,725 | 11,403 | 12,454 | 12,556 | 13,733 |
Trends in Degrees Tableau Visualization
An interactive Tableau visualization of trends in degrees; degree recipient demographics; and completed majors, named options, certificates, doctoral minors, and honors, is available.
To download the data from the Tableau visualization:
- Click the Download button at the top or bottom of the visualization. The location of the button varies depending on the web browser.

- Select Crosstab.
- Choose your desired format (Excel or CSV) and click download.
If you have questions about Tableau or downloading the data, contact Noah Natzke or Derek Field.
Additional information about majors, options, degrees, and certificates is available.
Historical Degrees by Award Level
Degrees Awarded by Fiscal Year, 1848-2025 (Annually since 1921): Table | Chart
Interactive Tableau visualization of degree trends and program-level counts since 1999-2000 (same as above)
Degrees by Disciplinary Division
Degrees by Disciplinary Division, 2016-2025 (PDF)