Overview
How understandable will your data be to other users, including yourself, in the future? This guide considers five common practices for documenting data, ranging from easy to more complex.
- Cite the source of your data
- Define your data using a data dictionary
- Describe the entire data package using a data specification or readme file
- Track data lineage to visualize your data processing pipeline
- Capture the reproducible environment and workflow of all changes made to your data
Did you know: UW–Madison has requirements for how we describe institutional data sources, elements, processes, integrations, and products? Use the data documentation standard when describing shared university data assets to be better communicated to ensure transparency, clarity, shared understanding, replicability, and ease of use.
1. Cite the source of your data
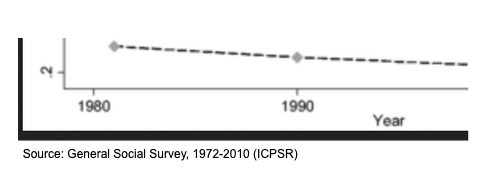
Simply naming the source of data used in a report or presentation can go a long way toward communicating transparency and trust in your findings. This could be in the form of a data citation or an acknowledgement below your table or graphic.
Example data source acknowledgment in a slideshow presentation or report

Example citation in a reference list or bibliography
Smith, Tom W., Peter V. Marsden, and Michael Hout. General Social Survey, 1972-2010 Cumulative File. ICPSR31521-v1. Chicago, IL: National Opinion Research Center [producer]. Ann Arbor, MI: Inter-university Consortium for Political and Social Research [distributor], 2011. Web. 23 Jan 2012. doi:10.3886/ICPSR31521.v1
Citations for data should at minimum include:
- Creator(s) or contributor(s)
- Date of publication
- Title of dataset
- Publisher
- Identifier (e.g., Handle, ARK, DOI) or URL of source
- Version, when appropriate
- Date accessed, when appropriate
2. Define your data using a data dictionary
Providing a data definition and using it consistently helps remove ambiguity about the meaning of commonly used data fields or data elements (e.g., “Academic year” may have a different meaning depending on the institution) and helps aid in data interpretation.
Tip: UW–Madison has 500+ official data definitions of elements used in institutional data sets and data sources. Search the RADAR Data Glossary.
A comprehensive list of definitions for a dataset is called a data dictionary, and lists a short and long name of the element, documents the data format or units of measurement, explains any codes or allowable values, and including the full definition or description that helps users search and understand the data element, and, if appropriate, any derivations.
Example data dictionary
| Name | Long name | Measurement unit | Allowed values | Definition |
| ID | Student ID number | Numeric | 0-999999 | ID number assigned to a student by an admitting office |
| group_num | Group number | Numeric | 200-900 | Group number defining student’s relationship to department |
| DOB | Date of birth | mm/dd/yyyy | 01/01/1900-
01/01/2099 |
Student’s date of birth collected in the admissions application |
To increase compatibility with other similar datasets, metadata standards help ensure that the list of data definitions used across the different data sources are the same and will help make integration of different data sources much easier. Some popular metadata schemas include:
- Data Documentation Initiative (social sciences)
- Dublin Core (archives and libraries)
- NIH Common Data Elements (health sciences)
Tip: UW–Madison Research Data Services offers a list of commonly used metadata standards for research.
3. Describe the entire data package using a data specification or readme file
A data specification goes one step further. It often includes the data dictionary, but also provides more meaning and context about the dataset. For example, a data specification may record basic metadata such as who created the dataset, for what purpose, methodologies used, and any access and reuse conditions. This information can be packaged as a plain text file (Example: a readme.txt file template available from Cornell University) or indexed as a record in a data catalog.
Things to include in your data specification:
- Title
- Creator(s), their affiliation, and contact information
- Access and sharing
- Access instructions
- Licenses and terms of use
- Software needed to use or understand the data
- Data specific information
- Data dictionary of elements
- Overview of the contents and sources
- Methodology of data collection or load frequency of how often the load process is run
- Data protection and retention information
Tip: Publish a data specification for your institutional dataset, data source, or data product in the UW–Madison RADAR data catalog.
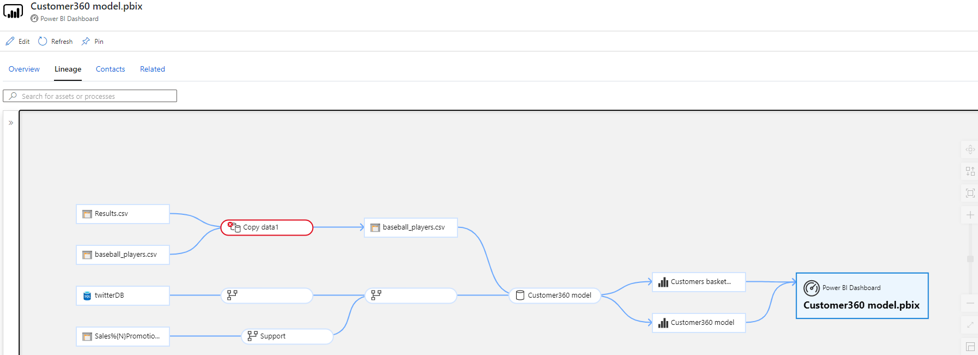
4. Track data lineage to visualize your data processing pipeline
Data lineage not only describes the source of where your data came from but also details all the transformation, calculations, and changes made throughout the process. Lineage can be a good way to visualize the data pipeline, or how each data element was coded, transformed, and outputted as new data elements. Tools like Microsoft Azure or Google Cloud Data Fusion can help visualize this journey.

There are several techniques to capture data lineage.
- Source to target map: A low-tech solution is to capture all the transformations made using a spreadsheet. You can add comments that detail each stage of the transformation for each data element in your dataset
- Data codebook: Tools like SPSS and SAS can help you export a record of the variables, codes, and transformations used in the data. Or you can track your work on your own in a plain text file, like this codebook template from a Coursera course on Data Cleaning.
Electronic Lab Notebook: ELNs capture more than just the data lineage, but they can be a great way to document the journey that your data takes during the transformation process and also helps date and timestamp discoveries (required for some patentable research). There are many ELN tools to choose from. See UW Madison’s ELN software offerings that are free to campus users.
#5 Capture the environment and reproducible workflow of all changes made to your data
Many data analysis tools will track all changes made during your workflow and communicate these in a friendly to use way. Tools such as:
- Git/GitHub Version Control
- R and RStudio
- Jupyter Notebooks
- Open Science Framework
- UW Madison Software Carpentry community offers regular training in these and more
For a dataset to be reproducible (e.g., someone else can follow your steps and get the exact same result) your documentation must not only include a complete history of all the changes made to the data (computational transformations and analyses), but also an exact run environment including the same operating system and software versions.
You can capture the complete analysis environment using tools such as:
- ReproZip: The UW Library reviewed this tool in 2017
- Docker: UW Research Computing offers guidance on how to use Docker
Learn more about reproducible workflows
UW–Madison instructor Karl Broman (Biostatistics & Medical Informatics) teaches Software Carpentry and other training workshops on reproducible workflows. See “Steps toward reproducible research” slides.