DAPIR provides data and analytic support, including peer comparisons when available, for student-related issues through the entire student life-cycle – from applying for admission to post-graduation plans. This includes analyses of application and admission trends; student enrollment trends; academic advising, retention and graduation rates; general education requirements; degree and certificate trends; and institution-wide student surveys.
Student Outcomes
Interactive Data Visualizations
DAPIR has developed Tableau data visualizations that allow users to explore trends in student data. Users can filter and disaggregate the information to topics of interest to the user. If you are unfamiliar with how to use a Tableau visualization, basic instructions are available.
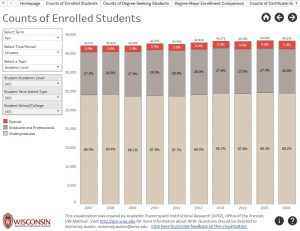
Trends in Student Enrollments: A visualization of trends in student enrollments, including headcounts of degree-seeking students by major and headcounts of students enrolled in certificate programs.
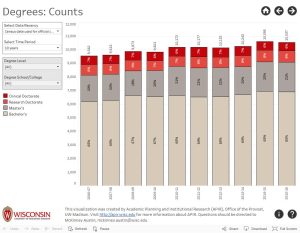
Trends in Degrees and Related Data: A visualization of trends in degrees, degree recipient demographics, majors, named options, certificates, doctoral minors, and honors.
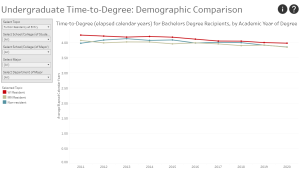
Trends in Undergraduate Time-to-Degree: A visualization of trends in undergraduate time-to-degree, including peer comparisons with other UW-Madison programs and similar programs at other major research universities.
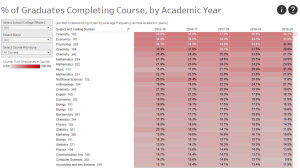
Courses Completed by Bachelor’s Recipients: A visualization of UW-Madison courses completed by bachelor’s degree recipients, which can be filtered by major, student attributes, and course attributes.